Key Terms:
Position- An objects position in respect to a coordinate system. Basically this is like an address or coordinates for some location. It shows you where the object is but not exactly how to get there.
Distance: The magnitude of length of the displacement vector. A displacement vector is a vector that shows the distance and direction traveled with a straight line.
Displacement: The change in position. For example if a car started at home and then drove five miles away from his house then the displacement would be five miles. If he then drove back the way he came for two miles then the displacement would only be three miles but his distance travelled would have been seven miles so Displacement and Distance are not always the same thing.
POSITION VS. TIME GRAPHS
A Position vs time graph is extremely self explanatory. On the Y-axis is the position(m) and on the X-axis is the time(usually in seconds). These are fairly easy to plot but they can tell us many different things. For example from a position time graph you can tell velocity, average velocity, distance travelled and displacement.
Here in this video Khan Academy does a great job of explaining how to extrapolate all of the data from a position time graph.
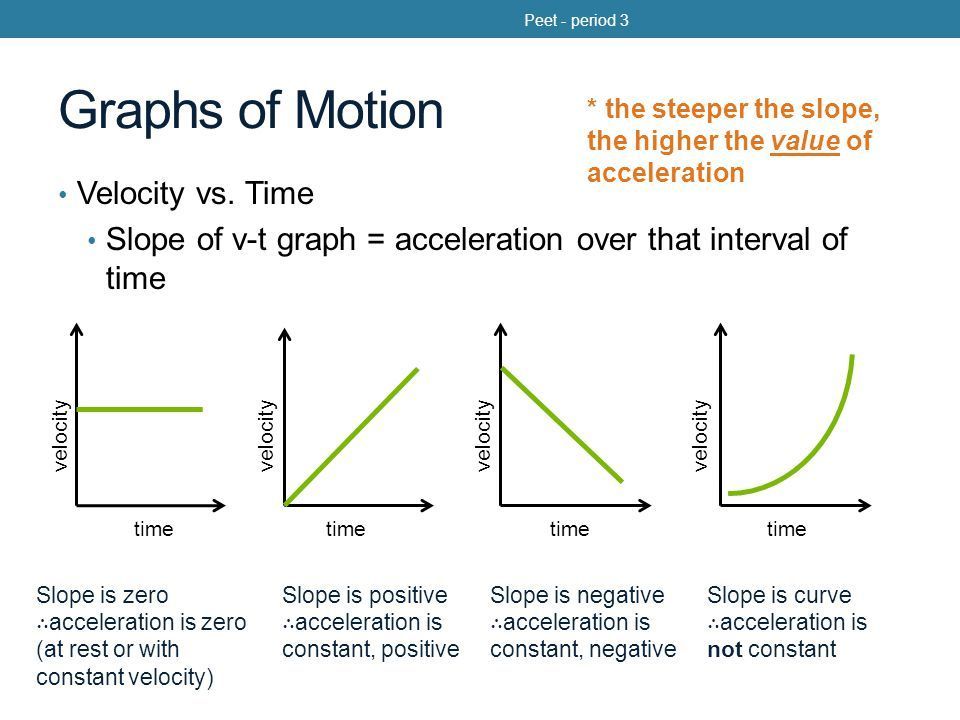
VELOCITY VS. TIME GRAPHS
These graphs show us how the velocity changes over time. It is also used to determine the acceleration. If the velocity is increasing at a constant positive velocity then it is a positive acceleration. If the velocity is staying constant then it is no acceleration and if the velocity is getting more and more negative or slowing down then it is a negative acceleration.
In the graph below it shows how a Velocity Time graph corresponds to an Acceleration Time graph.
Acceleration: The rate of change in the velocity over a unit of time. Velocity/Time
Velocity: The Speed of something in a give direction. Is the slope of a Position Time Graph. Distance/Time
Velocity: The Speed of something in a give direction. Is the slope of a Position Time Graph. Distance/Time
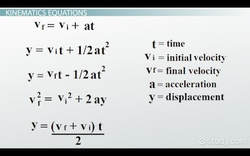
The Kinematic Equations are as followed and will allow you to solve for any of the following variables: Final Velocity, Displacement(change in position), acceleration, and time. Its just plug in the information that is known and then solve for the ones that are unknown.
This video is helpful on how to find the displacement(change in position)
This video is helpful on how to find the displacement(change in position)
HOW TO DESCRIBE THE MOTION OF AN OBJECT:
In describing the motion of an object, the direction in which that object is moving as well as the direction in which it is moving should be included.
For example, if the slope of a position time graph is negative and the values on the graph are still positive then the object is both moving backwards and slowing down. However, if it crosses 0 then it begins speeding back up just in a negative direction. What determines if an object is speeding up or slowing down is the steepness of the line. For a Velocity time graph it is much more clear to see if the velocity is slowing down or speeding up because if the slope of the line is negative then it is slowing down until it reaches 0 and then it is just speeding up in a negative direction. The same is true for a positive velocity. If the values of the velocity are positive and the slope of the line is positive then it is speeding up in a positive direction. If the velocity is negative and the slope of the line is positive then the velocity is slowing down until it hits the 0 threshold because the slope of the line is getting less and less negative. Once it passes 0 then it will be speeding up as long as the velocity remains positive.
For more explanations of Acceleration Time graphs then another Khan Academy video would be helpful.
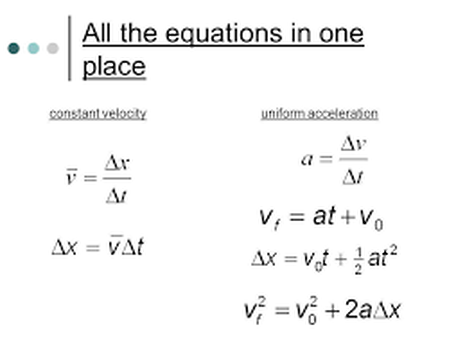
Solving Constant Velocity and Uniform Acceleration problems
When solving these types of problems then using the equations is essential. All that you are doing is trying to solve for unknown variables that are not listed in the problem.
Other helpful formulas-
When solving these types of problems then using the equations is essential. All that you are doing is trying to solve for unknown variables that are not listed in the problem.
Other helpful formulas-