The problem: How is the distance of the cart effected by the time rolling?
Independent Variable: The time rolling
Dependent Variable: Position
Constants: Steepness of the ramp, cart, method of data collection
Experimental Design:
1. Set up the ramp so that it remains at a steady incline for the entirety of the trials.
2 Set up the motion sensor with the car either rolling towards or away from it.
3. Release the cart fro the ramp while simultaneously starting the motion sensor so that the data collection is as accurate as possible.
4. Stop the buggy at the end of the ramp as well as stopping the motion sensor.
5. Repeat data.
For Video Analysis.
1. Set up the ramp so that it remains at a steady incline for the entirety of the trial.
2. Set up a camera from a god enough distance so that it captures the entire trial.
3. Release the cart from the top of the incline and record as you do so.
Materials:
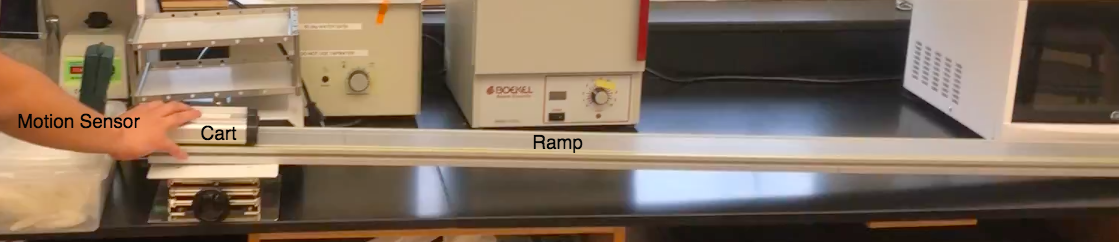
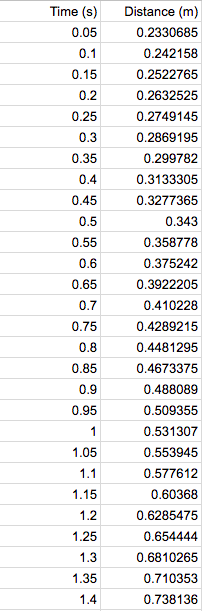
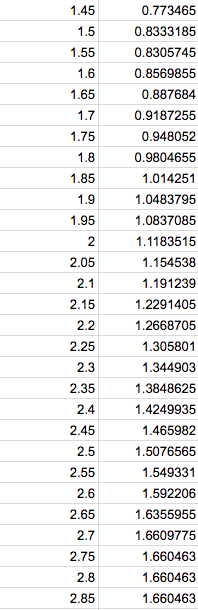
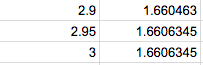
Motion Sensor Test 1
|
|
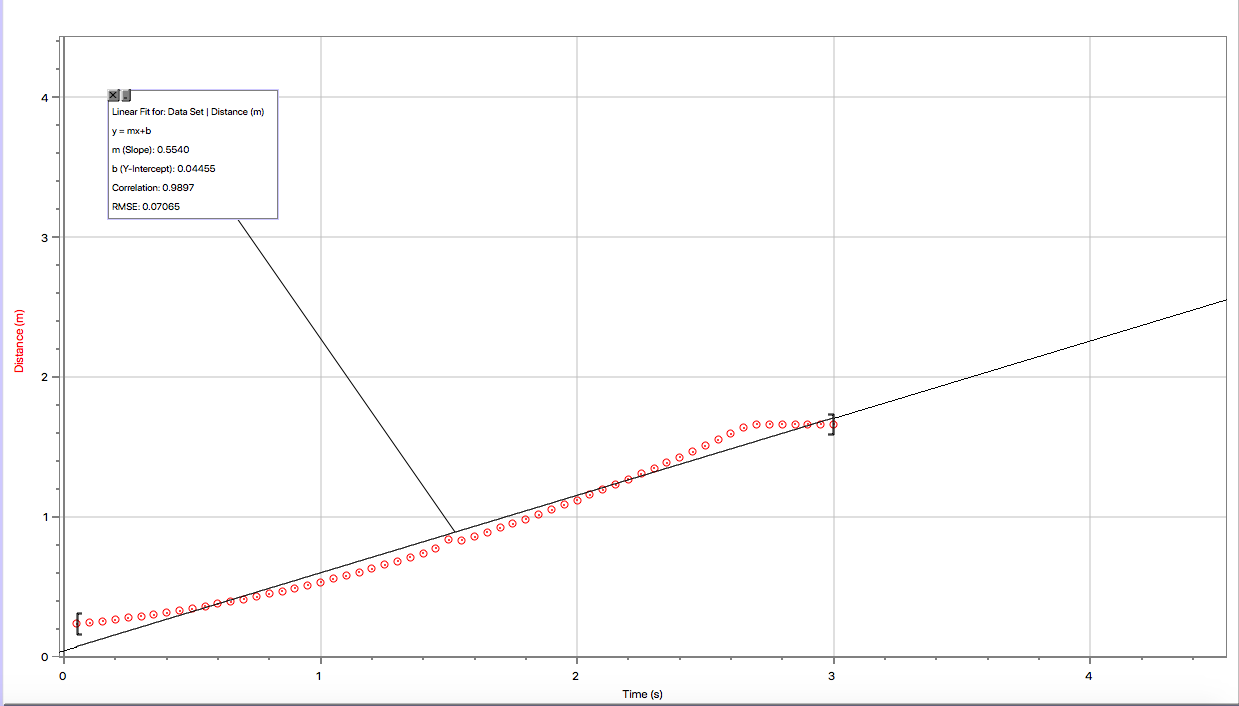
Analysis of the Graph-
Equation- Position= 0.5540*Time + 0.00404455
0.00404455 is the y intercept and is the distance that the cart started from the motion sensor and 0.5540 is the velocity of the car in meters/seconds. Some of the uncertainties in his data are the time that the motion sensor starts collecting data and when the cart is released down the ramp. This would cause for some sort of milliseconds in uncertainty and while it doesn't skew the data very much it is still a source of uncertainty in the data. Another source of uncertainty is tat the cart is stopped before data collection is stopped causing the graph to flatline and change the line of best fit.
Motion Sensor Test 2
|
|
Analysis of the Graph-
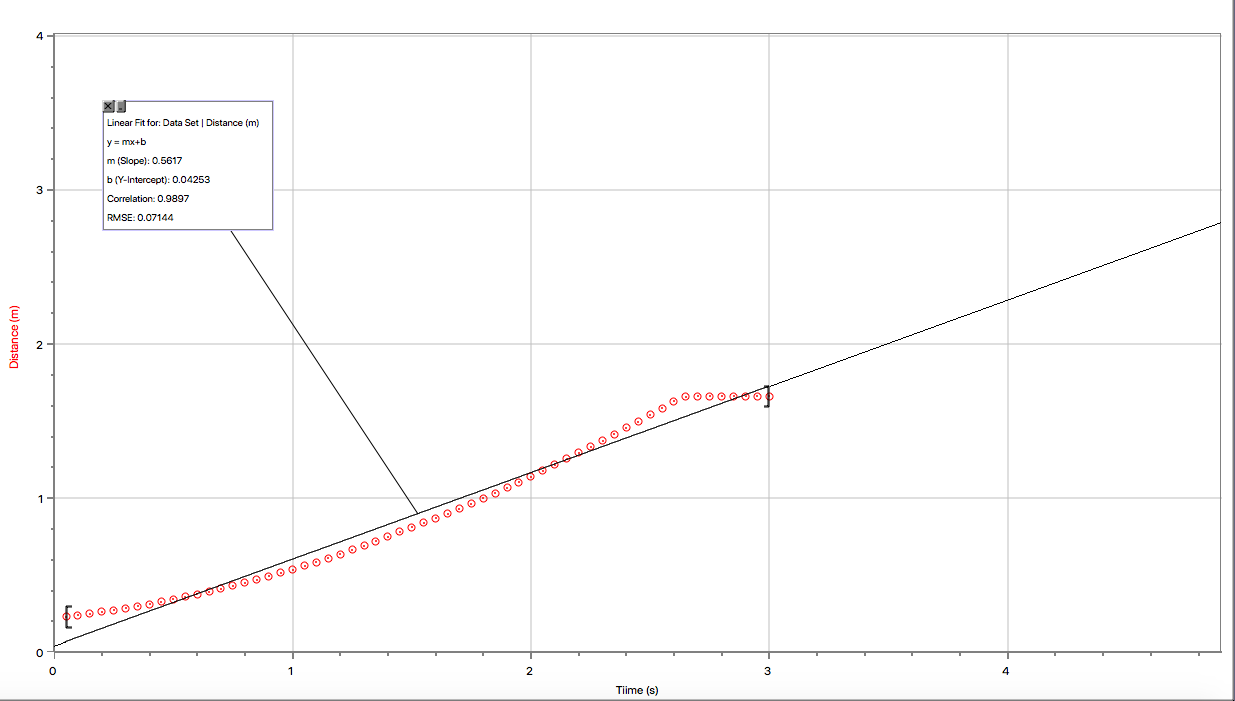
Equation- Position= 0.5617*Time + 0.04253
0.04252 is the y-intercept of the graph meaning that the graph starts at 0.04253 meters and 0.5617 is the velocity in meters/seconds.
Some uncertainties of this graph are the same as the other graph with the delay between when the cart is released and when data collection is started resulted on a millisecond difference in the time as well as not stopping the data collection right as the cart stops causing the graph to flatline at the end thus changing the line of best fit.
Motion Sensor Test 3
|

|
Graph Analysis-
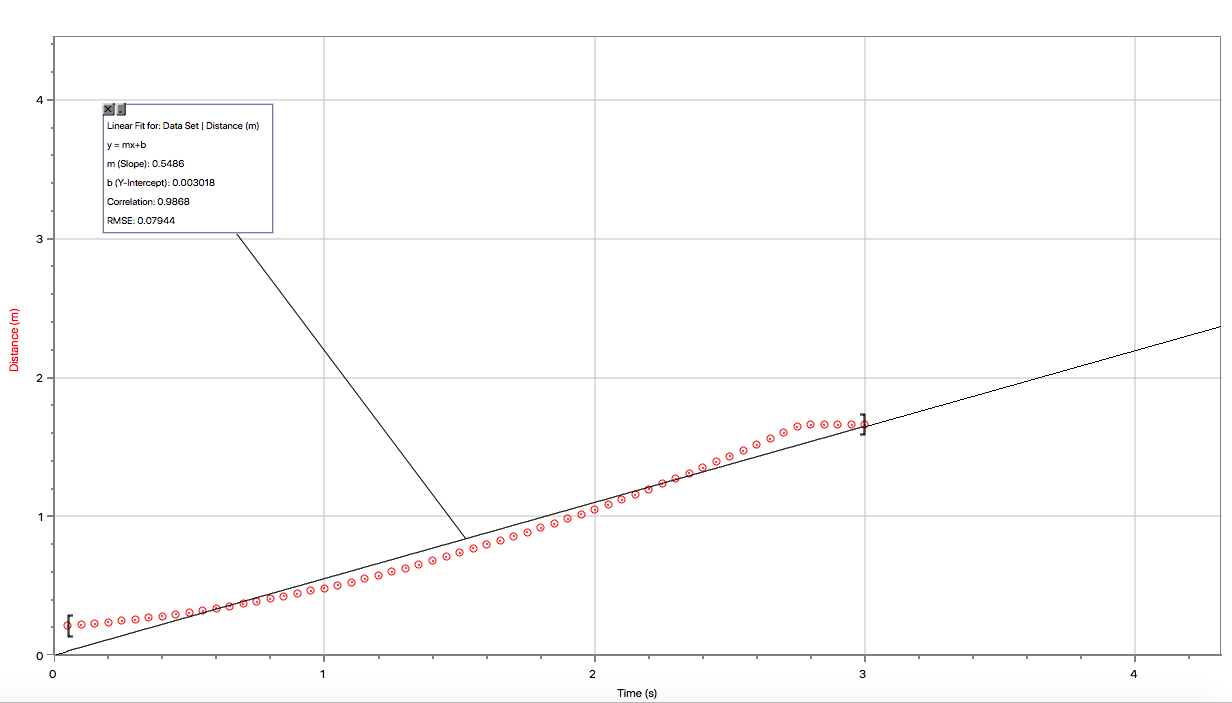
Equation- Position= 0.5486*time+ 0.003016
0.003016 is the y-intercept that shows the starting point of data collection and 0.5486 is the velocity of the cart in meters/second.
Some uncertainties of the data are the exact same as the other two with the possibility of data collection being off by a couple of milliseconds because the difference in the time when data collection starts and when the motion sensor is started with the data collection. Also the not stopping the data right when the cart stops which causes a flat line at the end of the graph and skewing the line of best fit.
Motion Sensor Test 4
|
|
Graph Analysis-
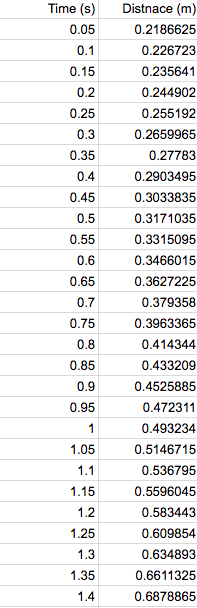
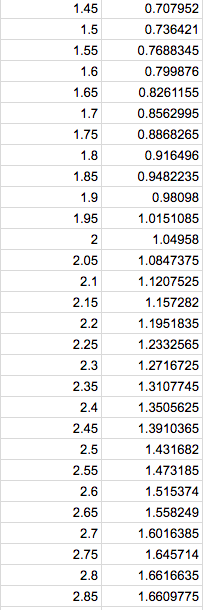
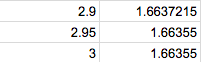
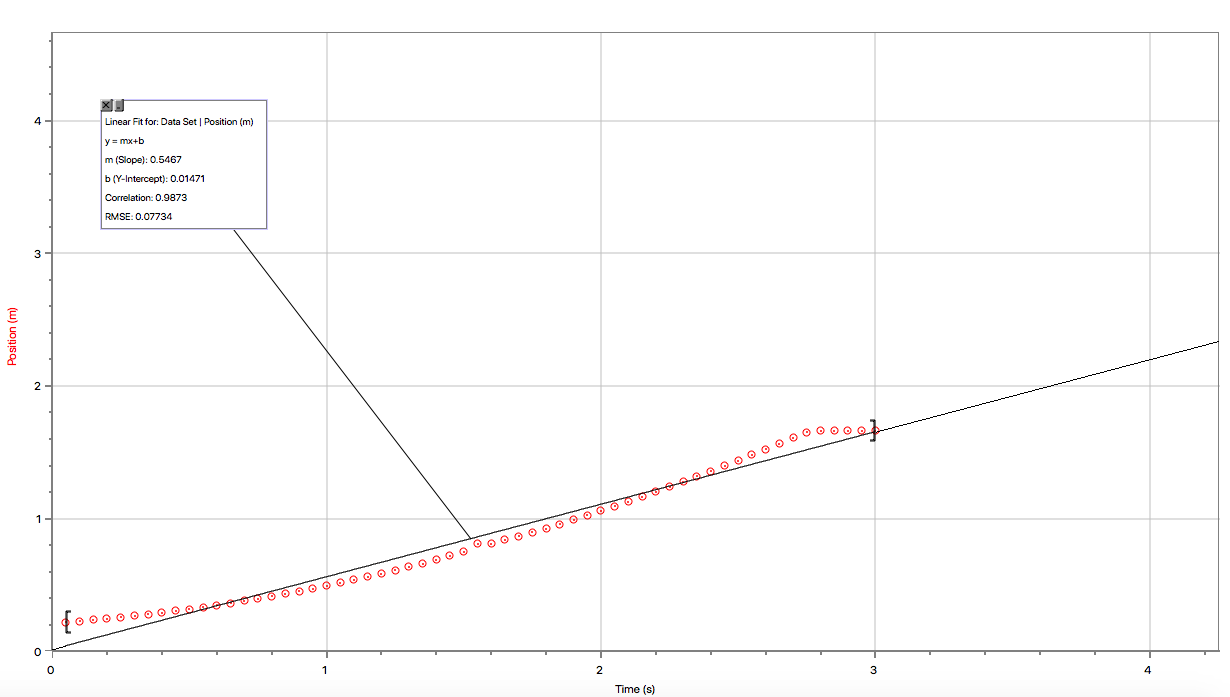
Equation- Position= 0.5467*time + 0.01471
0.01471 is the y-intercept and it is the starting point for data collection and 0.5467 is the velocity in meters/second
Some sources of uncertainty are the delay between the motion sensor recording and the release of the cart down the ramp causing an uncertainty of a couple milliseconds into the data as well as not stopping data collection right when the cart was stopped causing a flatline at the end of the graph which skews the line of best fit.
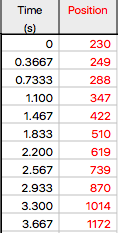
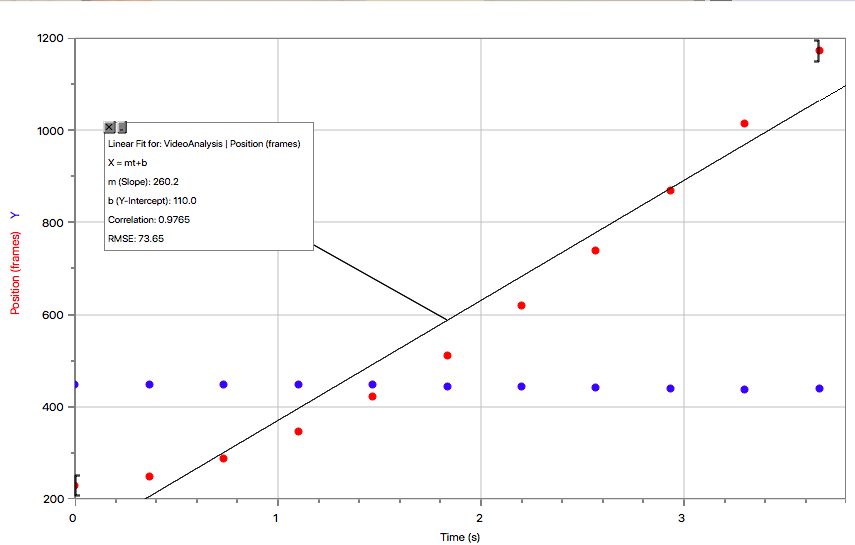
Video Analysis
|
|
Graph Analysis-
Equation- Position= 260.2*time + 110.0
110.0 is the y-intercept and starting position of the cart and 260.2 is the velocity in frames/second.
Some uncertainities in this graph occur during the video analysis with placing te point on the same spot of the car each time which could result in a +/- 10 frame difference.
Conclusion
In conclusion, it is shown that time and the distance the cart goes down the incline are linearly related. As the time increases so does the distance travelled. This is shown in every trial with every one of them having a clear and distinct linear slope. Some sources of uncertainty during tis experiment were the delay between when the cart was released and when data collection was started. To fix this, starting the data collection and then releasing the cart down the incline would lead to a more accurate and precise data collection because it would show exactly when the cart started moving. Changing this would lead to more precise results however the general conclusion is still the same: the time and distance in this experiment are linear related.
In conclusion, it is shown that time and the distance the cart goes down the incline are linearly related. As the time increases so does the distance travelled. This is shown in every trial with every one of them having a clear and distinct linear slope. Some sources of uncertainty during tis experiment were the delay between when the cart was released and when data collection was started. To fix this, starting the data collection and then releasing the cart down the incline would lead to a more accurate and precise data collection because it would show exactly when the cart started moving. Changing this would lead to more precise results however the general conclusion is still the same: the time and distance in this experiment are linear related.
