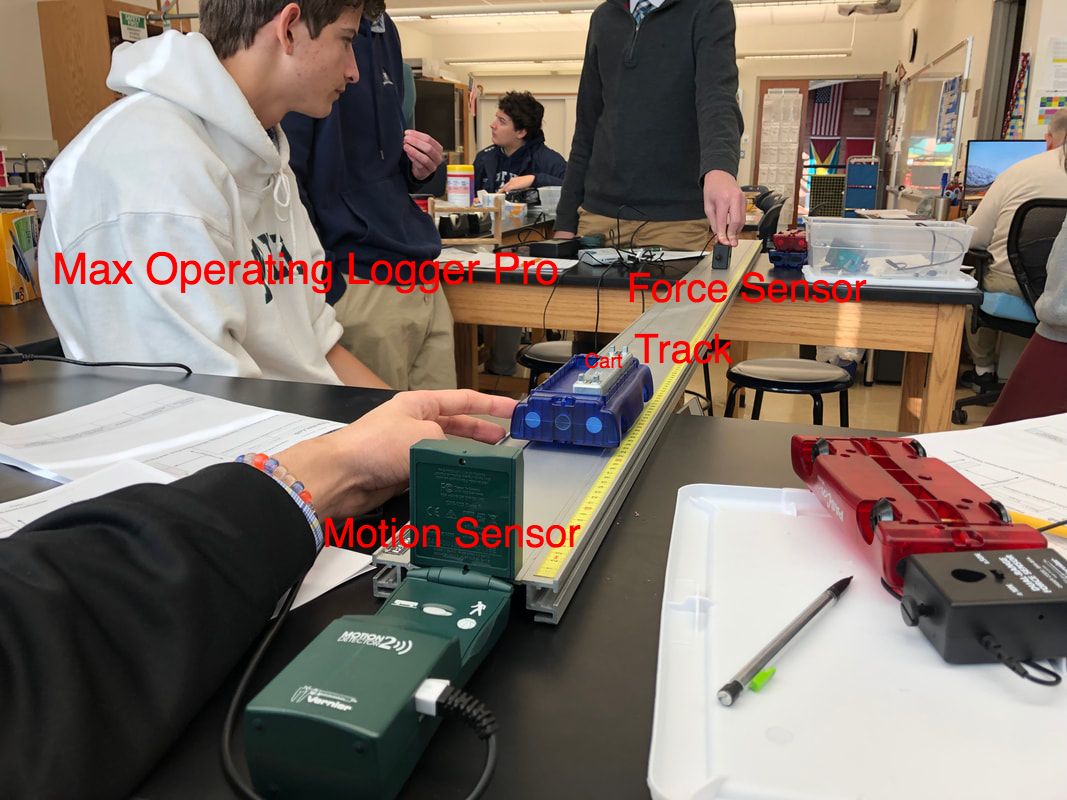
In this we are testing if Impulse(J) is the change of average force over time, the area under a force vs. time graph and if it is the change in momentum. In this we set up a cart, a motion sensor and a force sensor so we could collect force, velocity and time.
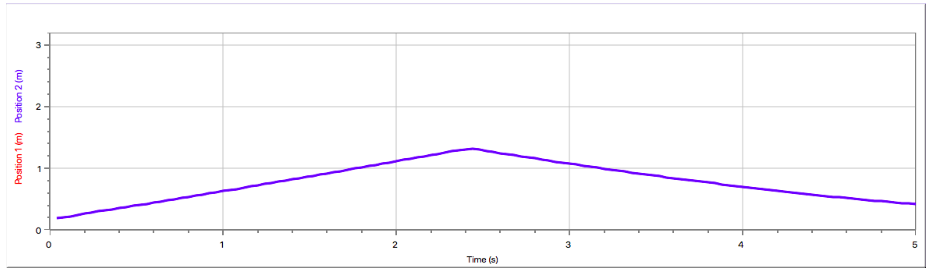
Position(m) vs. Time(s)
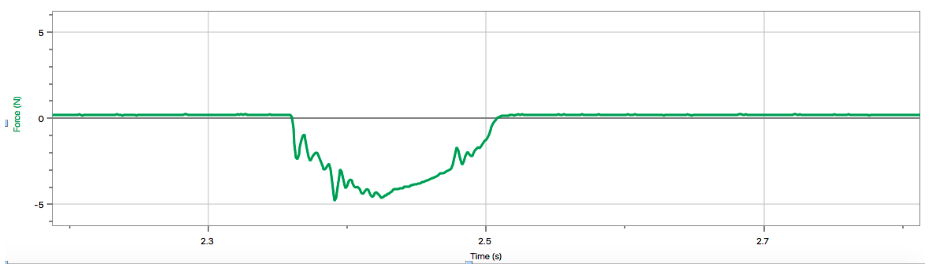
Force(N) vs. Time(s)
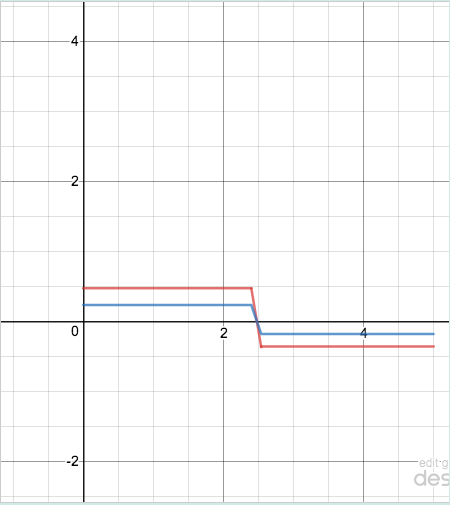
Velocity vs Time is in Red
Momentum vs Time is in Blue
Momentum vs Time is in Blue
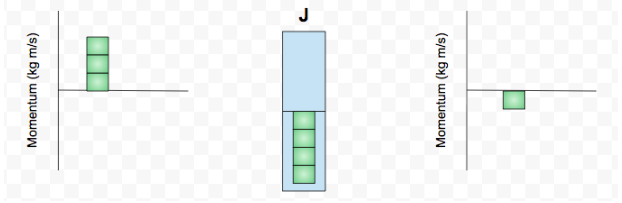
The Initial momentum must be positive because it has a positive velocity. Once the the cart hits the force sensor the force sensor pushes back a negative impulse that pushes the cart back towards the motion sensor and it slows down from the impact because some kinetic energy is transferred into the force sensor.
0.501kg * 0.477m/s = Initial Momentum:0.23 kg*m/s
0.501kg * -0.355m/s =Final Momentum -0.17 kgm/s
J= P final - P initial = -0.42 kg*m/s
Impulse from Force vs Time Graph= -0.37 kg*m/s
|-.41+0.37| / 0.37 = 1.01% error
0.501kg * -0.355m/s =Final Momentum -0.17 kgm/s
J= P final - P initial = -0.42 kg*m/s
Impulse from Force vs Time Graph= -0.37 kg*m/s
|-.41+0.37| / 0.37 = 1.01% error
By using the slope of the position vs. time graph before the collision with the motion sensor it is determined that the initial velocity of the cart was 0.47m/s. The final velocity was found by using the slope of the position vs. time graph after the cart hit the force sensor. That number was -0.355m/s. Knowing the mass of the cart being 0.501kg you can find the momentum before and after the hit by using Kg*m/s. This gives us 0.23kg*m/s initially and -0.17m/s finally. Using the formula for impulse which is P Initial - P Final it was concluded that the impulse was -0.42kg*m/s. Using logger pro and the area under the force vs time graph it was shown that the impulse from that was -0.37 which was one 1.01% off of the data that was collected through calculation. Since this is such a low percent error it is proven that impulse is the area under a force vs. time chart.
Areas of uncertainty:
Some uncertainty in this lab could have been the assumption that it was a frictionless track while there was some friction that was not accounted for. Also there were spikes in the data that the force sensor recorded instead of it being a perfect parabola which could have also led to a slight variance that could have caused the 1.01% error.
Some uncertainty in this lab could have been the assumption that it was a frictionless track while there was some friction that was not accounted for. Also there were spikes in the data that the force sensor recorded instead of it being a perfect parabola which could have also led to a slight variance that could have caused the 1.01% error.
Widget is loading comments...
