The Problem: How does the time a tumbler buggy operates affect the distance it will travel?
Independent Variable: The time the buggy travels for.
Dependent Variable: The distance that the buggy travels.
Controls: The surface on which the buggy travels as well as the buggy itself.
Procedure:
Video Analysis -
Independent Variable: The time the buggy travels for.
Dependent Variable: The distance that the buggy travels.
Controls: The surface on which the buggy travels as well as the buggy itself.
Procedure:
Video Analysis -
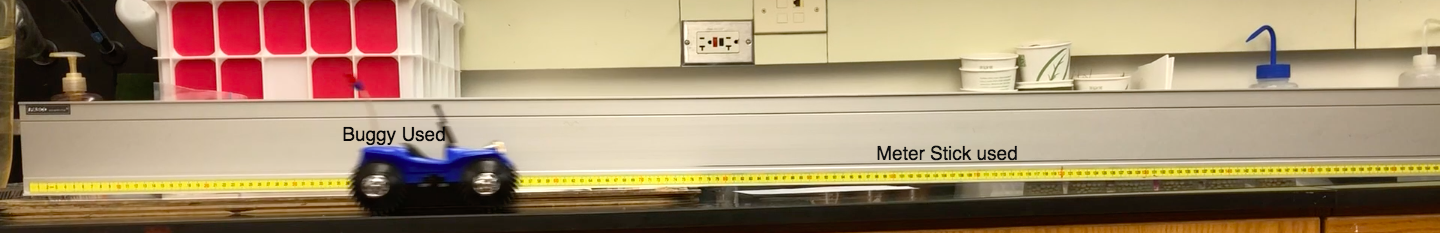
- Set up the camera to look at a side of the buggy so it moves across the screen from left to right
- Include a meter stick in the frame so we can scale the video analysis later
- Record at least one video of the buggy running across the screen. It should start moving off screen, and then enter the screen and leave before we stop recording. The buggy should travel no less than 2 meters to have a decent range of data.
- Save the video and import it to a computer. Then use LoggerPro to run a video analysis and create a position vs time graph, and analyze your results.
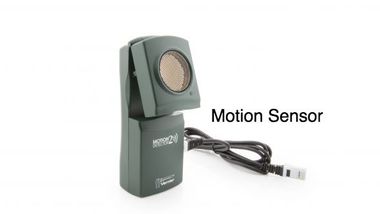
- Connect the motion sensor to the LabQuest mini, and connect the LabQuest mini to the computer and open LoggerPro.
- Start the buggy moving away from the motion sensor, THEN start recording data. The buggy should be moving and it should be about 10 cm from the motion sensor when data collection starts (motions sensors do not record data if an object is too close.
- Stop data collection and analyze the position vs time graph, and analyze your results.
- Start the buggy and let it run until it reaches the edge of the meterstick.
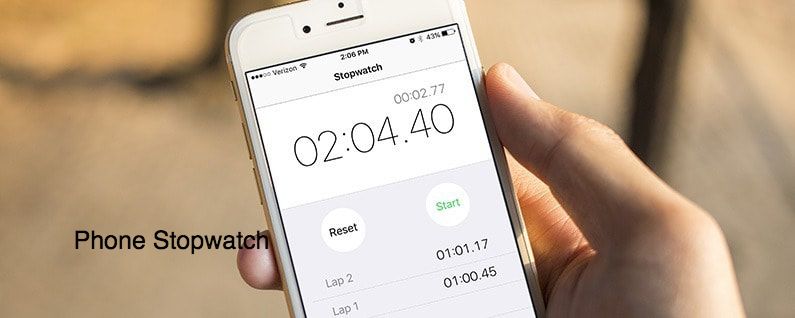
- When the buggy reaches the meterstick, start the timer/stopwatch and let it run for 0.5 seconds.
- At the 0.5 second mark, mark/record the position of the buggy.
- Repeat steps 1-3 for increasing times until we have collected at least 5 measurements and have measured a time of at least 5 seconds. Be sure to use the same buggy for each measurement, and use the same surface.
- Create a plot of position vs time and analyze your results.
Materials:
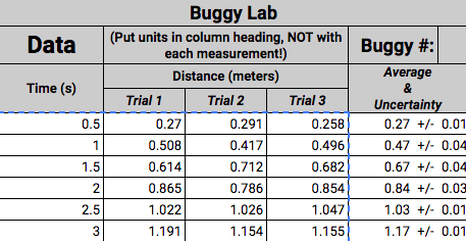
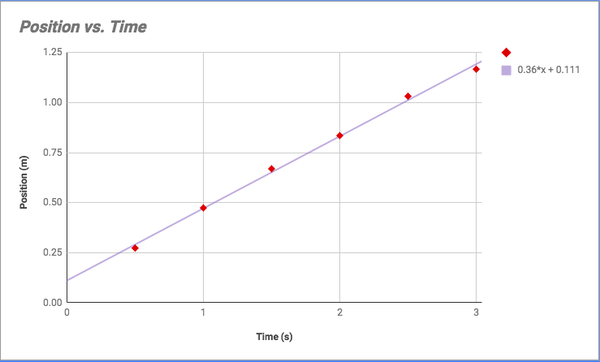
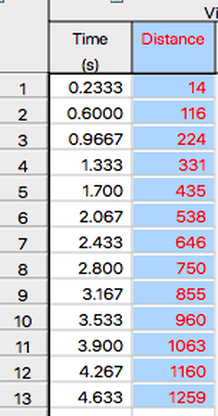
Stopwatch Trials
|
|
The equation for the stopwatch trials is X= 0.36*t + 0.111.
Some uncertainties in the data are the reaction time of the people collecting the data and stopping the buggy at the time stated. This caused for some slight variance in the data that is preseneted.
Some uncertainties in the data are the reaction time of the people collecting the data and stopping the buggy at the time stated. This caused for some slight variance in the data that is preseneted.
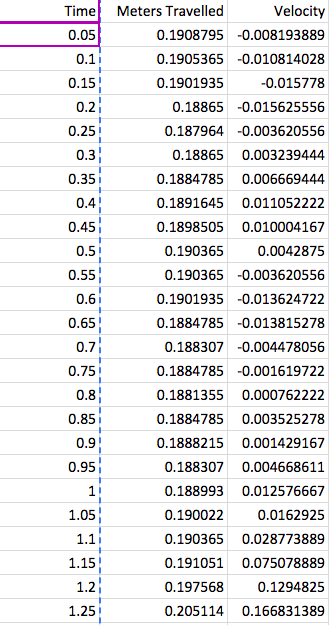
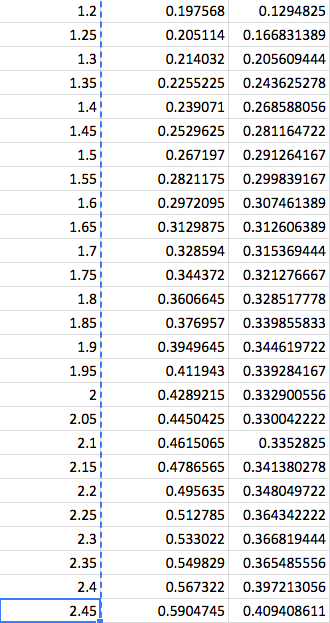
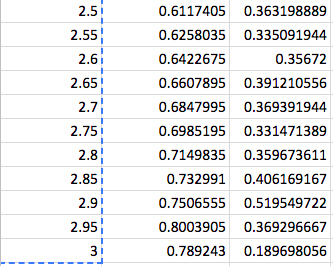
Motion Sensor Trials
Trial One
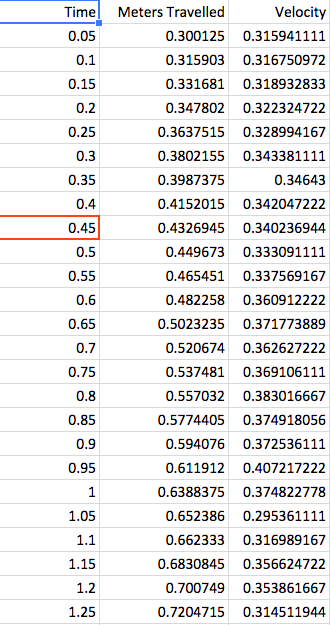
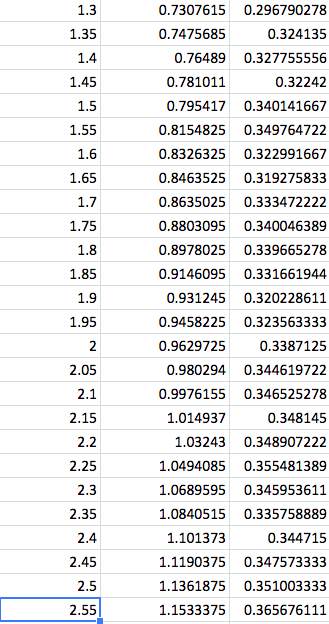
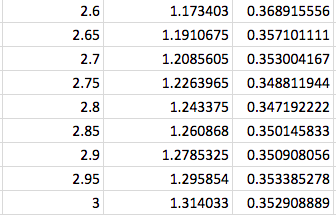
Raw Data
Trial One
Raw Data
|
|
Motion Sensor Trial One Graph
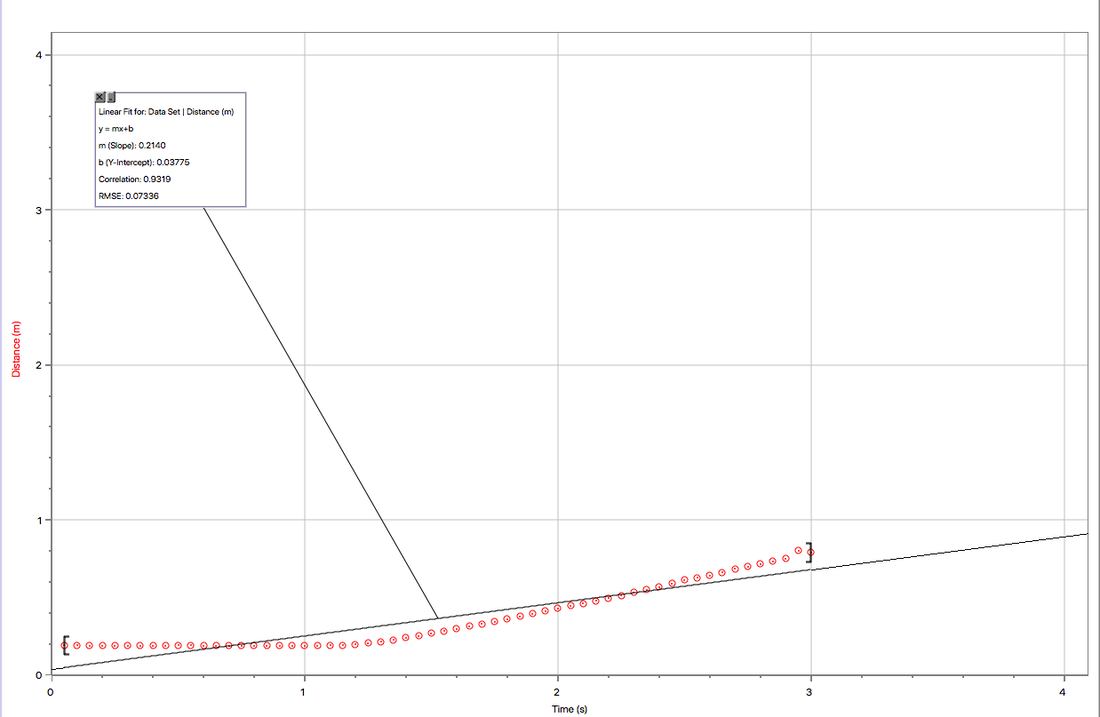
A formula for this data is: x= 0.2140t + 0.03775
0.03775 is where the buggy initially started. A source of error and uncertainty in this graph is that for te first second of data collection the buggy appears to not be moving which in turn can lead to an inaccurate line of best fit also making this graph look more exponential when it is linear.
0.03775 is where the buggy initially started. A source of error and uncertainty in this graph is that for te first second of data collection the buggy appears to not be moving which in turn can lead to an inaccurate line of best fit also making this graph look more exponential when it is linear.
Motion Sensor Trial Two
Raw Data
Raw Data
|
|
Motion Sensor Trial Two Graph
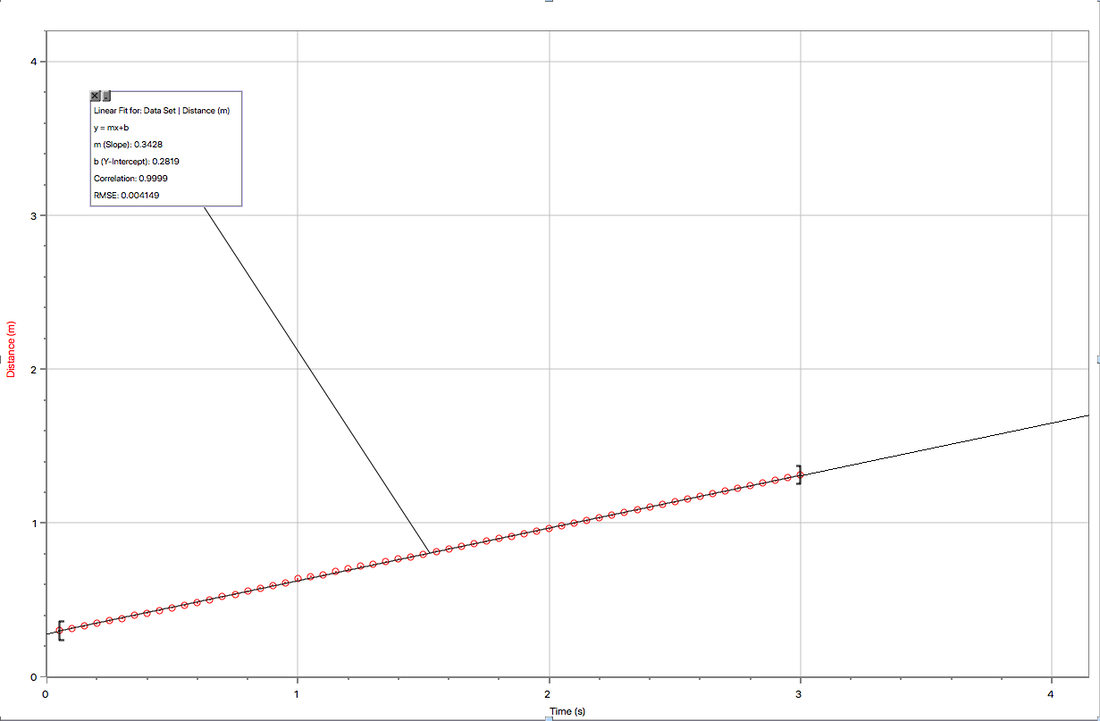
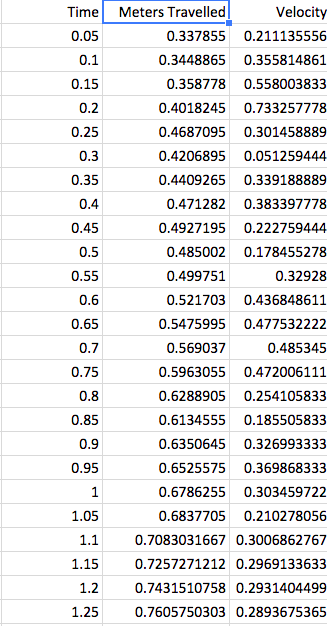
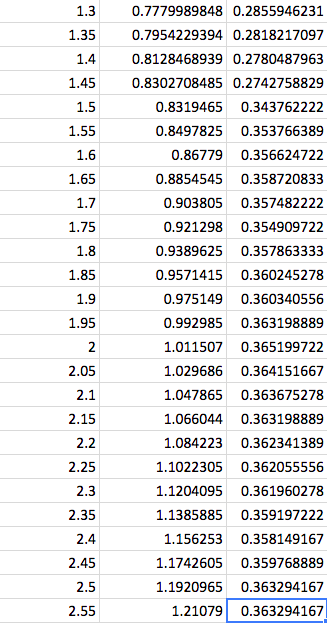
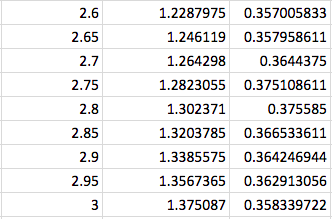
The Equation of the graph is x= 0.3429t + 0.2819
The y-intercept is the starting point of the buggy which is 0.2819 meters.
There are less uncertainties in this graph compared to the first test because it looks completely linear with no exponential tendencies.
The y-intercept is the starting point of the buggy which is 0.2819 meters.
There are less uncertainties in this graph compared to the first test because it looks completely linear with no exponential tendencies.
Motion Sensor Trial Three
Raw Data
Raw Data
|
|
Motion Sensor Trial Three Graph
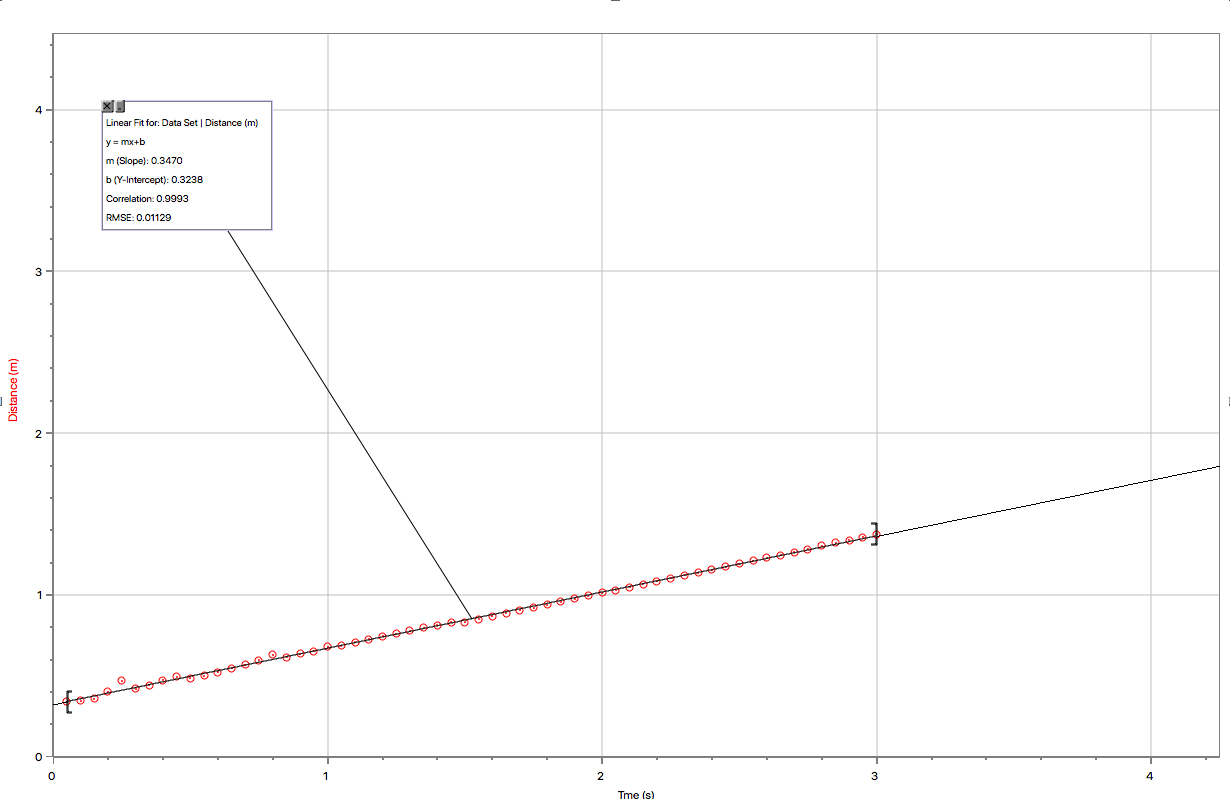
The Equation for this graph is x=0.347*t + 0.3238
The y-intercept is 0.3238 meters and shows the starting point in which data was collected.
Some sources of error and uncertainty in this graph are the few outliers that make me believe that three was an error in the equipment being used.
The y-intercept is 0.3238 meters and shows the starting point in which data was collected.
Some sources of error and uncertainty in this graph are the few outliers that make me believe that three was an error in the equipment being used.
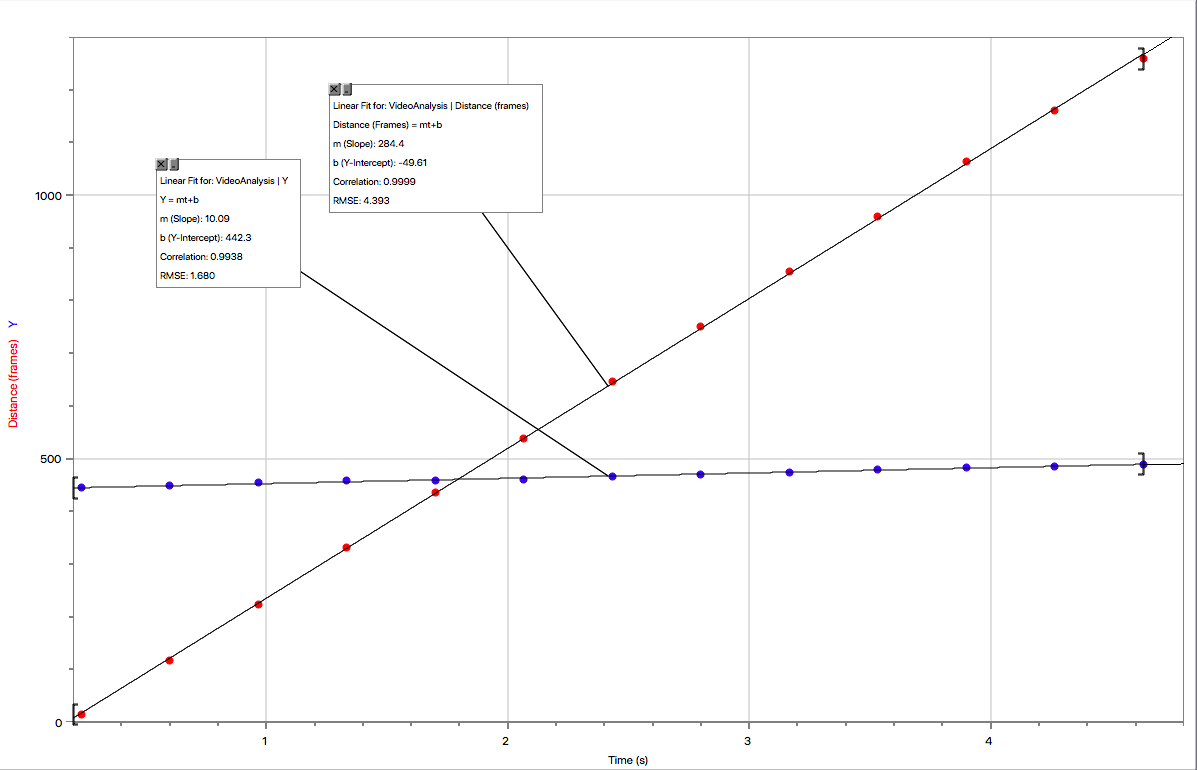
Video Analysis
|
|
The equation for the buggy's motion is x= 284.4*t - 49.61 and the equation for the change in acceleration over time is x= 10.00*t + 442.3.
The y-intercept for the buggys motion is the starting point from which data was recorded. The Y-intercept in the acceleration line is the starting velocity.
Some sources of error and uncertainty are that the y-intercept is negative meaning that maybe there was an error in the video analysis. Another source of uncertainty is that this is measure in frames and not meters which lead to a slightly different looking graph.
Conclusion
In conclusion, based off of multiple trials and three different methods of testing the correlation between time and distance of a buggy going down a ramp is linear. With the exception of one graph, which is an outlier, the graphs all had a clear and linear slope. Even the one graph seemed to be a mistake in when the data was being collected and how to start or stop the motion sensor thus making the buggy stand still for the first second of data collection. This data can also allow us to draw the conclusion that something going down an incline, as long as it is the same level of incline throughout, should have a linear correlation provided there are no outside factors that could skew the data
Sources of Error
Two main sources of error were the reaction time with the stopwatch and measuring the data at the the correct time. That trial was limited by the person reaction time on how quickly they could see the time and stop the buggy, all while measuring where the buggy was started. Another source of error, that is prevalent in the first motion sensor test is the lack of knowledge of how to use the motion sensor. This allowed for an anomaly to appear on the data which in turn was an outlier. A way to improve this lab would be to have the same person holding the stopwatch measuring the distance as to cut out any more reaction time of a person hearing and then having to stop the buggy. As well making sure that the knowledge of all equipment is thorough as to allow for more accurate measurements. And then, of course, more time as to take more tests that can give you wider range of data to analyze.
