Experiment 1- Net Forces and Acceleration
Question: What effect does changing the Net Force on a system have on the acceleration of the system?
Independent Variable: The Net Force
Dependent Variable: The acceleration
Constants: The total mass of the system.
Procedure
Question: What effect does changing the Net Force on a system have on the acceleration of the system?
Independent Variable: The Net Force
Dependent Variable: The acceleration
Constants: The total mass of the system.
Procedure
- Measure the mass of our system (cart, string hanger, all of the hanging masses, etc.)
- Connect a motion sensor to LoggerPro to collect motion data (Position-Time and Velocity-Time graph)
- Record total mass of the hanger (or net force) and release the cart from rest while the motion sensor is collecting data.
- Record the acceleration by calculating the slope of the resulting Velocity vs. Time Graph
- Repeat steps 3 and 4 for ___ different hanging masses
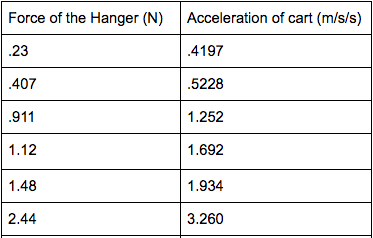
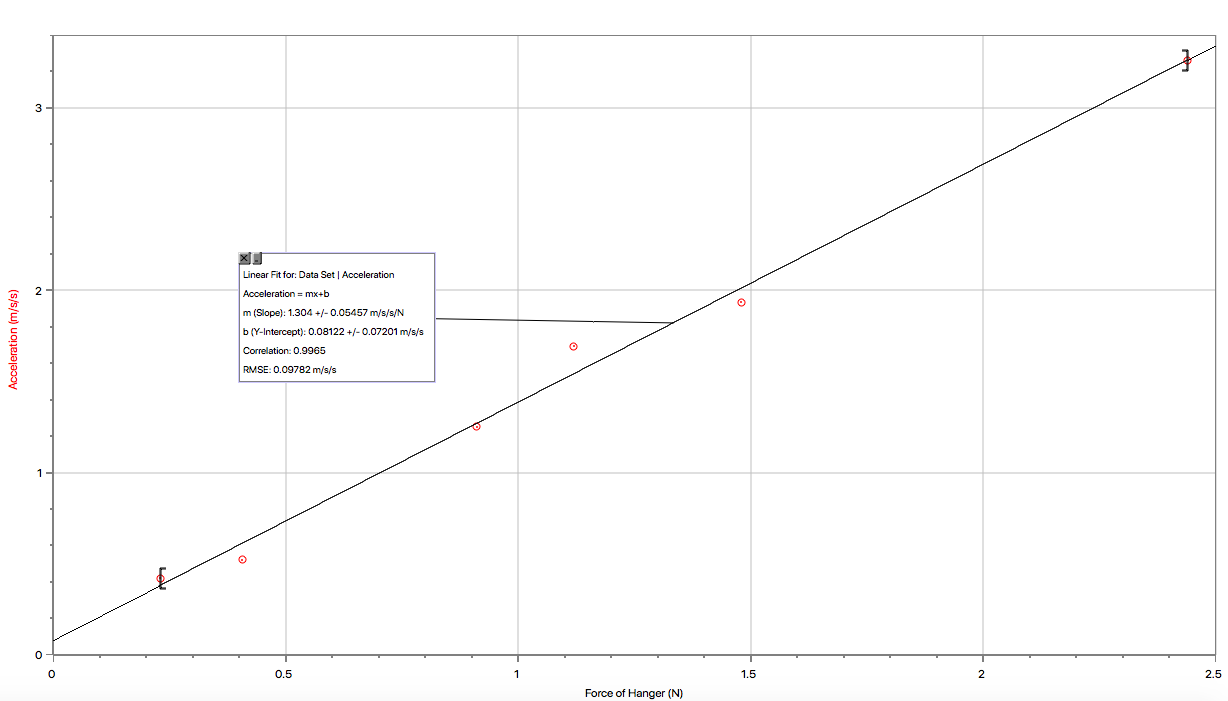
The slope of this line is 1.304 +/- 0.05457 m/s/s/N which is saying that for every 1.304 N added there will be a 0.05457 change in acceleration. The Net force is directly related to the acceleration of the object and that is shown by the fact that as Net Force increases s does acceleration. The uncertainty would be only 0.010-0.100 m/s/s due to a level of friction involved.
Materials (for both)

Experiment 2- Mass and Acceleration
Question: What effect does changing the total mass on a system have on the acceleration of the system?
Independent Variable: Total Mass acting on the system.
Dependent Variable: The Acceleration
Constants: The Net force of the system.
Procedure:
Question: What effect does changing the total mass on a system have on the acceleration of the system?
Independent Variable: Total Mass acting on the system.
Dependent Variable: The Acceleration
Constants: The Net force of the system.
Procedure:
- Measure the mass on the hanger (or Net Force)
- Connect a motion sensor to LoggerPro to collect motion data (Position-Time and Velocity-Time graph)
- Record total mass of the system and release the cart from rest while the motion sensor is collecting data.
- Record the acceleration by calculating the slope of the resulting Velocity vs. Time Graph
- Repeat steps 3 and 4 for ___ different system masses.
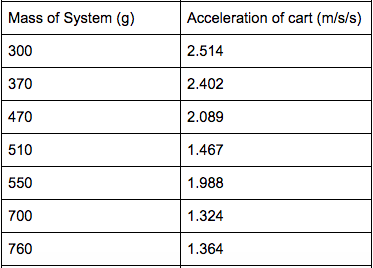
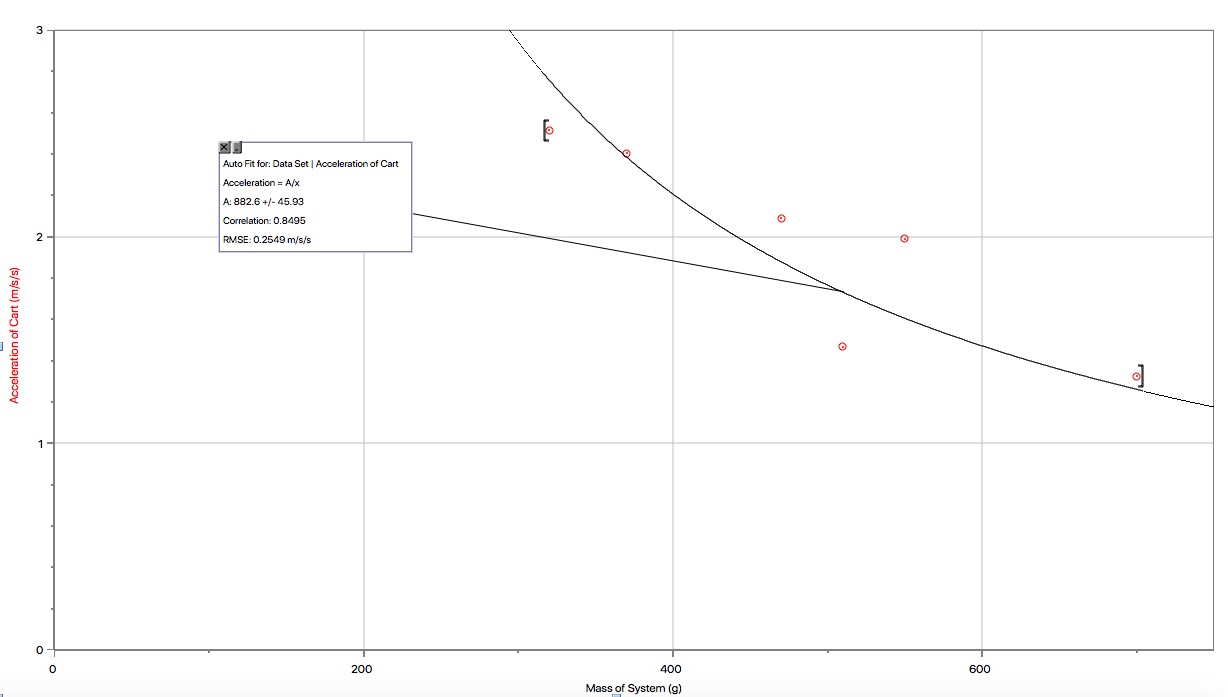
This graph shows an inverse relation between mass added to a system and the acceleration of this system. It is shown that as mass increases the acceleration decreases. There is no X or Y intercepts however, because if there were an x intercept then it would imply that the graph at a certain mass starts acceleration in the opposite direction which doesn't make too much sense and also the reason for there being no y intercept is that there can't be 0 mass for the system. There are some uncertainties here by about +/- 0.500 m/s/s because of some uncertainties within the data collection
Conclusion:
Experiment 1: This experiment proved that net force and acceleration are directly related. The higher the net force in a system then the higher the acceleration of that system will be. This was proved with the slope of the graph being linear. A way to improve the investigation was for a larger sample size of data as well as negating some friction coefficient that could have been involved making the data off of what the actual correlation between the two variables was.
Experiment 2: This experiment shows that there is an inverse relationship between mass and acceleration with acceleration decreasing as mass increases. The graph does show this but just in a smaller sample size. The curve of best fit does not include all of the data points and if a bigger range of data was given then there would have been a more distinctive inverse curve of the graph. The friction and potential 'bumpiness' of the track could also have attributed to a skewing of the data with the cart not truly being able get going in a lot of way. A larger sample size and a lack of friction/a service that would sometimes catch the wheel (slowing the cart down) would have displayed an inverse relationship much more effectively.
